Extreme Times Call for Extreme Data
The recently concluded 2017 hurricane season was one of the most devastating seasons in US history. As such, in early November the Police Data Initiative hosted a webinar entitled "Open Data for Disaster Recovery: Extreme Times Call for Extreme Data." Featuring PDI co-founder Denice Ross, currently a Public Interest Tech Fellow at the New America Foundation, and Jeff Reichman, a civic technologist and founder of January Advisors, this webinar examined a range of disasters -- both historical and recent -- to discuss the importance of data and data analytics during disaster recovery efforts.
New Orleans, 2005
Ross was heavily involved in using data to measure the recovery in New Orleans after Hurricane Katrina struck in 2005. When describing the data environment in 2005, a researcher at the Brookings Institute shared that it was “easier gathering data for Iraq than for New Orleans”, referring to efforts to track recovery of Iraq after the US invasion in 2003.
Ross discussed her experience with disaster recovery data in post-Katrina New Orleans. The disaster -- occurring in 2005 between decadal Census counts -- made estimating repopulation very difficult. As a result, Ross’ team decided to use the Valassis Residential and Business Database of addresses actively receiving “junk mail” as a proxy for repopulation. (In fact, before the Census 2010 population data were released, the New Orleans Police Department (NOPD) used these “junk mail” population estimates in calculating crime rates). During the disaster response, reliable information for repopulation estimates was able to help inform local planners and community members as they decided the best locations for health clinics, police outreach, and more.
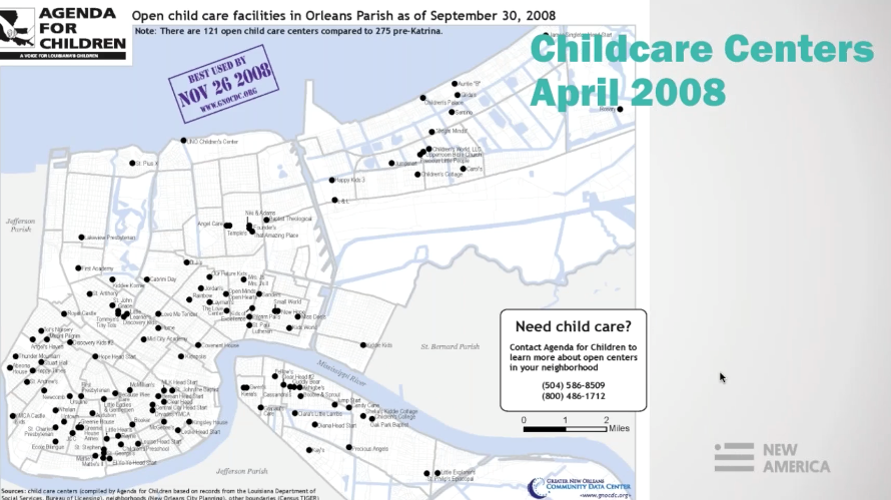 Other areas of concentration included publishing data on community assets such as police station and child care center re-openings, which helped with continued disaster response planning and with keeping the local community informed.
In the absence of more established data collection platforms at the time, residents in New Orleans also began tracking the recovery on their own, by initiating data collection on the status of “blighted” properties, vacant and storm-damaged properties that had a higher presence of crime and vermin. In addition, Ross’ team, in collaboration with fellows from Code for America, helped make building code enforcement data accessible and easy to use so interested parties could watch the status of any given blighted property in the code enforcement process and, with common factual bases, work toward solutions.
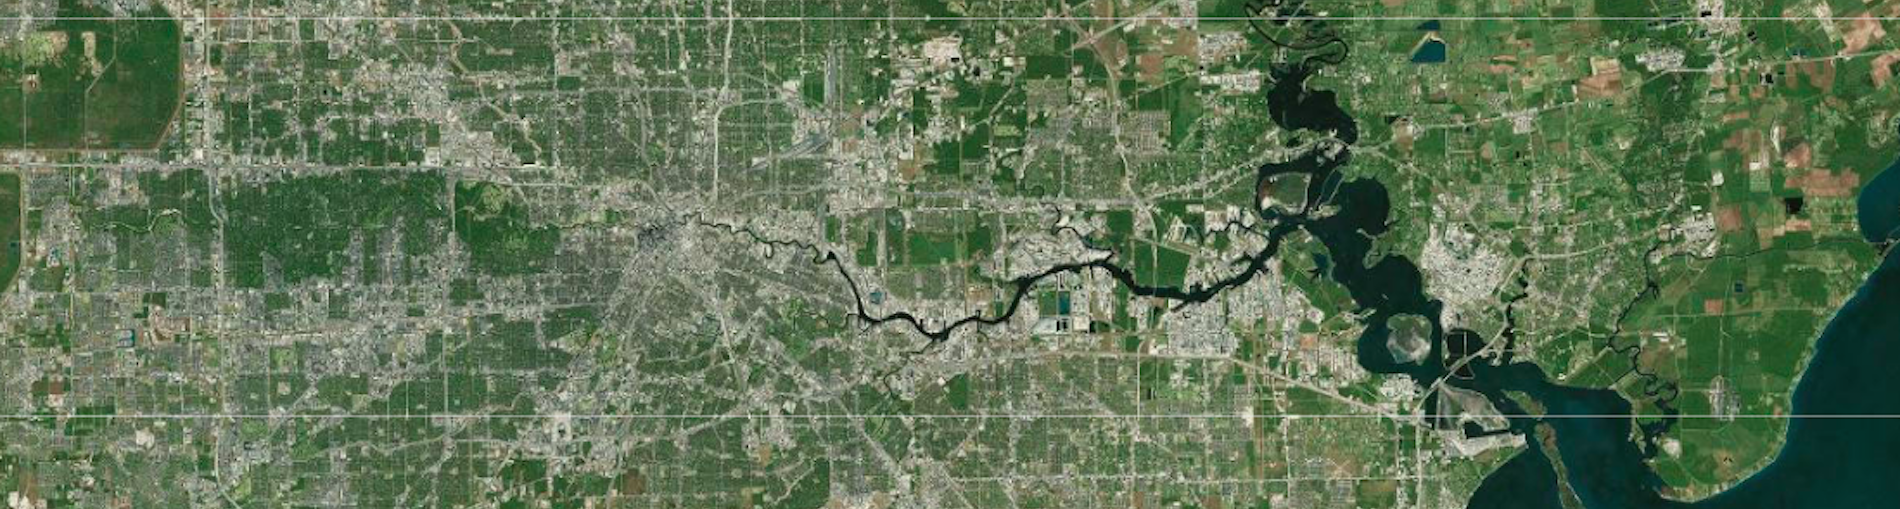
Houston, 2017
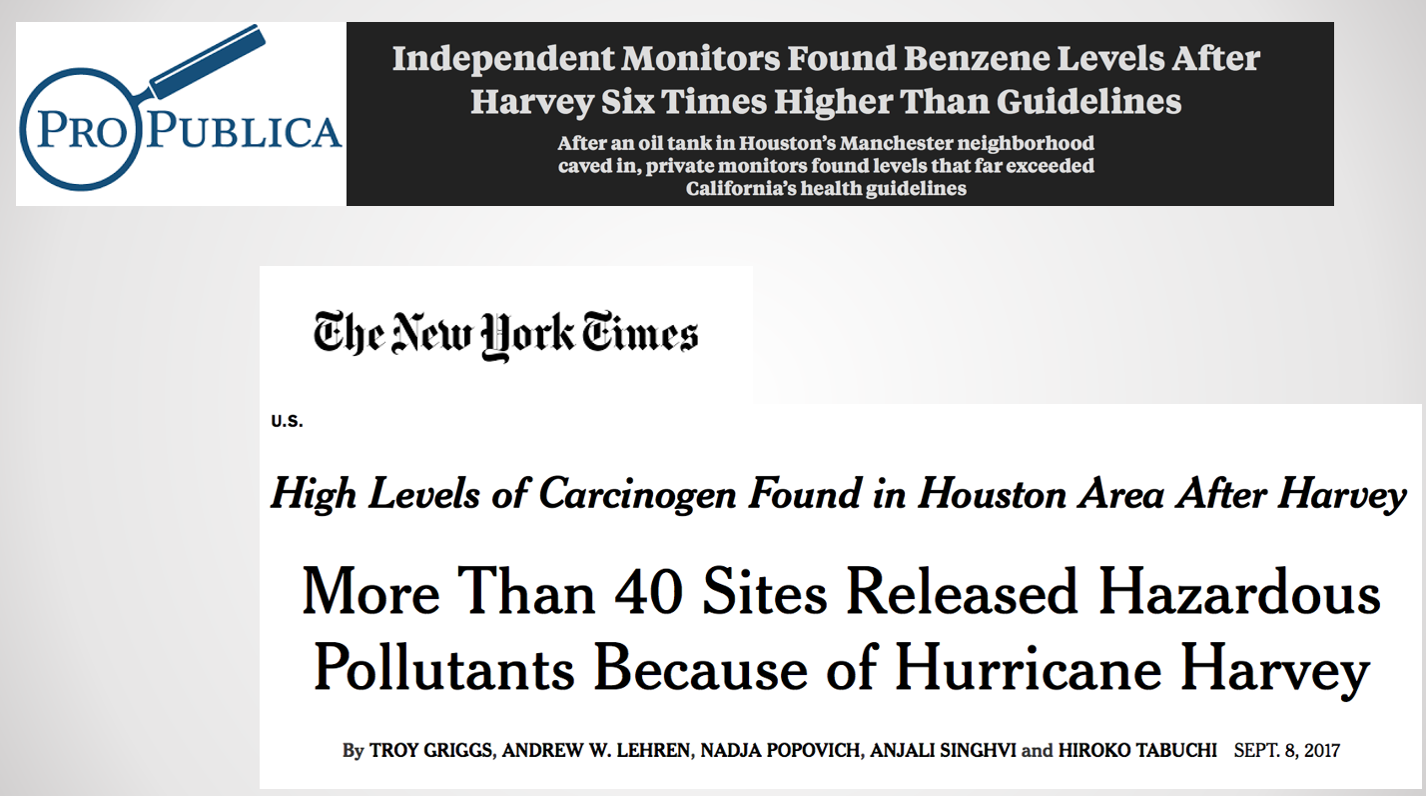 Reichman runs a Code for America Brigade in Houston and discussed his work using data during and after Hurricane Harvey. Reichman worked to scrape websites containing difficult to understand data on toxic emission readings and make them easily readable for a more general audience.
Some data collection may need to begin immediately so it helps to have plans in place in case of such an emergency. As Reichman notes, air pollution information dissipates quickly so “it’s really important to be able to track it, to know what you’re looking for, and to archive it so that it’s available for scientists to review later.”
Just as city planning for disaster scenarios should occur far in advance, plans to use data during disasters should also be set in place ahead of time. As Ross notes,“When you plan for the data collection during blue skies it’s a lot easier to deploy afterwards.”
Other examples of data being used to improve disaster response:
- During the Wine Country Fires of 2017 the Santa Rosa Police Department -- a Police Data Initiative member -- used data to create a tool whereby citizens could input an address and find out whether that address was within a mandatory evacuation area. The department took to social media to effectively spread awareness of their tool.
- The Miami Police Department was alarmed during 2017’s Hurricane Irma when pictures surfaced of storm surges that were reaching areas that should not have been impacted. Within days, city officials and residents began collecting storm surge levels throughout Miami in order to create more accurate maps based on actual data from a real world event. This information can now be used to inform future evacuation decisions and help preparation efforts for potential flood events.
Top Photo Credit: Image of the Houston Area. Esri, Earthstar Geographics, CNES/Airbus DS.
Are you sharing data that can support disaster response and recovery? Tell us more at PDI@policefoundation.org or find us on Twitter at @PoliceOpenData